
Band Map & DX Spotting Help
This page will take you though all the band map features, so you can get the most out of this cool tool!
Getting Started...
This video details setting up DX Spotting, including the band map.
Getting Started Written Documentation...
To set the band map to display each time you start the software, on the DX Spotting set up form, check the check box to display the band map on start up. If the band map isn't currently displaying and you want to bring it up now, press Ctrl E.
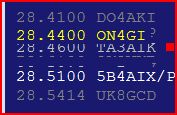
The band map can be displayed either horizontally (left image) or vertically (right image). All the functions discussed below work identically with either orientation. More spots can be displayed in the vertical orientation, since each just takes on character, so in the vertical orientation, the entire call and frequency are displayed. In the horizontal orientation, only the prefix is displayed.

|

|
In either orientation, after clicking on the band map form's title bar to give it focus, you can mouse over the spot and a tool tip will display the entire call, frequency and the time you received the spot. To change orientation, just mouse over the band map and click the Horz / Vert button (which will appear for five seconds) to change orientation.
Screen Layout...
If you are displaying the logging software at 100% screen size, when you first bring up the band map, it is likely covering a portion of the program's main form. To make room for the band map on your screen, click on the main form's side edge (for vertical orientation) or bottom (for horizontal orientation) and hold your left mouse button. Then drag the edge of the form towards the center, to make room for the band map. When you release the mouse button, the controls on the form will reposition appropriately. Then place the band map where you want it on your screen and size it to your preference. Both the main form and band map size and location settings are saved, so next time you start the software, both forms will remember the size and location you choose.
I See Spots!...
As spots are posted, depending on the filters you have set on the DX spotting set up form, spots will begin to appear for the band you are currently on. As you change bands in the contesting software, the band map will update for your new band.
For AC Log and the contesting software, if you are using rig interface, the band map will update for the new band as you change bands on your rig. If you aren't using rig interface, just enter your current band in AC Log's band field and then tab to the next field. The band map will follow right along!
The color of the spot identifies how old it is as follows:
Yellow Bold = < 3 minutes
Yellow = 3 - 5 minutes
White = 5 - 10 minutes
Light Gray = 10 - 20 minutes
Gray = 20+ minutes
Italic = Needed multiplier (contesting software) or entity (AC Log, based on Settings > New Contact & QSL Alert Options)
Red (remains red) = Needed entity who is an LoTW User (AC Log only: eLogs > LoTW and click ID LoTW Users)

Only the last 200 spots are held in RAM, so during busy times, depending on your filtering, you may not see any gray spots.
If you are using rig interface, a red dot will indicate your rig's current frequency. Click on the red dot to display the change frequency form.
Clicking on Spots...
Left click a spot. The call will be entered in your call field and your rig will tune to the spot frequency (with rig interface enabled).
Right click a spot to remove the spot from the display. If spotted again it will reappear, unless you have logged the contact and have the block duplicates filter enabled in the contesting software.
But wait, I see too many spots!?...
During popular contests, the band map can fill up quickly. The most recent spots are always on top, but spots start to overlap and it is hard to tell what's going on. These next sections describe how to easily display all of the spots:
Auto Scale...
With auto scale disabled, the map will display the entire band. Check the auto scale option and the band map will dynamically resize to the highest and lowest frequency spotted for the band, as long as the Zoom label isn't displaying.


Auto scale is off, displaying the entire portion of the 10 meter band.

A capture of the same spots a few moments earlier. Auto scale is on, displaying only the spotted segment of the band.
Zoom...
Even with auto scale enabled, spots still can overlap. In that case, just zoom in on the section of the band you are working!
To zoom in on a section of the band map, first click on the title bar or blue area of the form to give it focus. Then, put your mouse over the area of the map you want to zoom in on. Turn your mouse wheel forward (or use the + and - keyboard buttons). Move your mouse to a new location to update the target of the zoom. Try it now. You'll see what we mean much more clearly.
After scrolling, you can click on the Zoom label to enter a specific frequency range.
Once you zoom in on a section of the band map, the map is locked on that section and won't display any spots posted outside the area of the zoom. To clear the zoom, scroll out, Right click the Zoom label or press Esc while the Band Map form has focus.
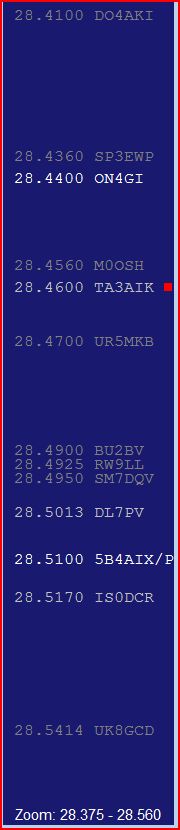
Here is an example of the Zoom feature. Displaying the whole 10 Meter band, here are what appear to be a few spots in a portion of the phone segment. The red dot on the right is my 756 Pro II's current frequency and many of the spots are overlapping:
After clicking on a blue area of the form and placing my mouse over the center of the overlapping spots, I turn my mouse wheel forward to zoom in and reveal many more spots to choose from!
Click and Drag...
You can also click on the blue area and drag your mouse to update the zoom range.
Zoom and Follow with Rig Interface...
With rig interface enabled, to have the band map follow along with your rig's current frequency, click the title bar of the band map to give it focus. Then press F. The band segment will default to 50 KHz, but you can place your mouse over the red dot that indicates your rig's frequency and scroll your mouse wheel to narrow or enlarge the segment display. Alternatively, click on the Zoom label and enter two frequencies, which will define the range that will update as you change frequency on your rig. Tune your rig and the band map will follow right along!
Clearing Zoom...
Remember, whether auto scale is checked or not, you will not see any spots outside of the zoom range while you are in zoom mode. To clear the zoom, Right click on the Zoom label or press Esc while the Band Map form has focus.

Right click the Zoom label to clear the zoom.
Click and Pounce Contesting...
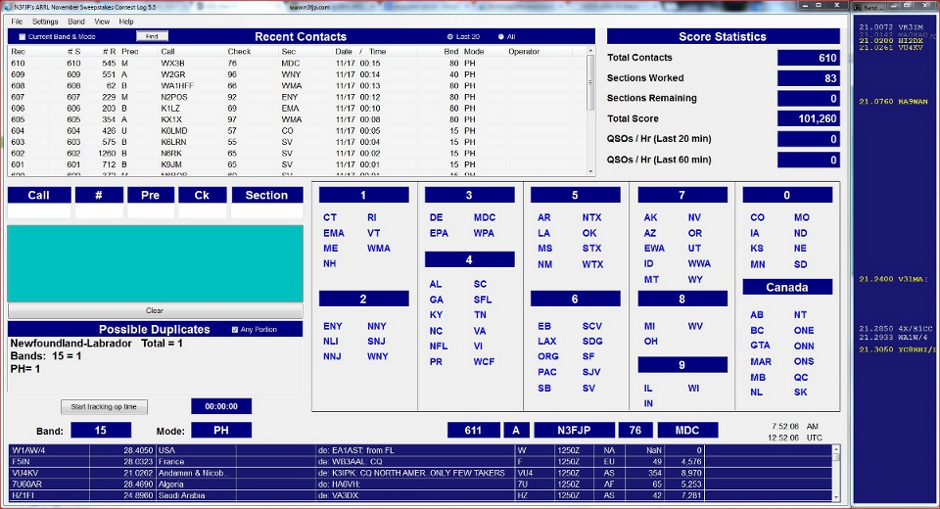
2014 November Sweepstakes SSB was a great opportunity to take advantage of the new band map, the ability to scale the main form to fit the band map to the right and the ability to filter DX spots to exclude contest duplicates! Running 100 watts and mostly wire antennas (http://www.n3fjp.com/antennas/), my friend Dave, N3HCN and I wound up with the sweep and 610 Qs in the log. We ran frequencies when we could, but we spent a lot of time in search and pounce mode.
After a while, searching and pouncing can become a bit fatiguing, tuning from one QSO to the next, figuring out who is running the frequency, only to discover he is already in the log. So, instead of searching and pouncing, we started clicking and pouncing! We laid out the band map as in the screen shot below and set the SS software to filter out contest duplicates. Then, one band at a time, we clicked from one spot to the next, working our way down the band, until we worked all the current spots on the band. Then it was off to the next band. We managed to keep our run rate near 40 Qs per hour (and sometimes more) using this method. Most of all, it is much less fatiguing, since you know who's frequency it is, the call is already entered when you click on the spot and that the call isn't a duplicate. Run a frequency when you can, since your run rate will be much higher, but the click and pounce method is a great alternative when you can't!
Two things to be careful of with Click and Pounce. First, a significant percentage of DX spots have the call wrong in the posted spot. Make sure you hear the call for yourself and correct when needed. Second, not all calling stations are spotted, so don't give up while you are waiting for new spots to appear. Keep tuning!
Here is a quick, Click & Pounce tutorial:
During the 2015 CQ WPX CW contest, my good friend Dave, N3HCN came up and we operated under our club call, NE3MD at my QTH. Clicking and pouncing with 100 watts and dipole antennas, Dave had the QSO rate over 60 Qs / hr for a bit:
![]()
Copyright 1997-2025, N3FJP Software - Affirmatech, Inc